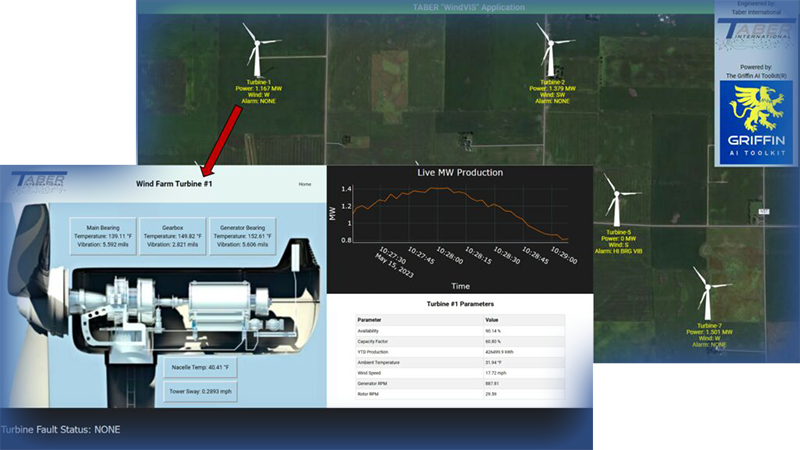
Visualize important data for your process in real-time in one convenient location with custom dashboarding. Taber provides fully customized dashboarding solutions to bring together multiple sources and types of data into a “one-stop shop” for monitoring and visualizing key aspects of your process.
Customizable Dashboards
Dashboards can be simple displays of key process metrics, directly reflecting points available from existing systems (PI, DCS, PLC, etc.) or can be the results of dedicated analysis and processing performed on live data using Taber’s applications.
The main feature is that the format and content of these dashboards is ENTIRELY CUSTOMIZABLE, to the level of site areas (engineering, operations, planning, etc.) or even down to individual personnel preferences.
Logging and Reporting
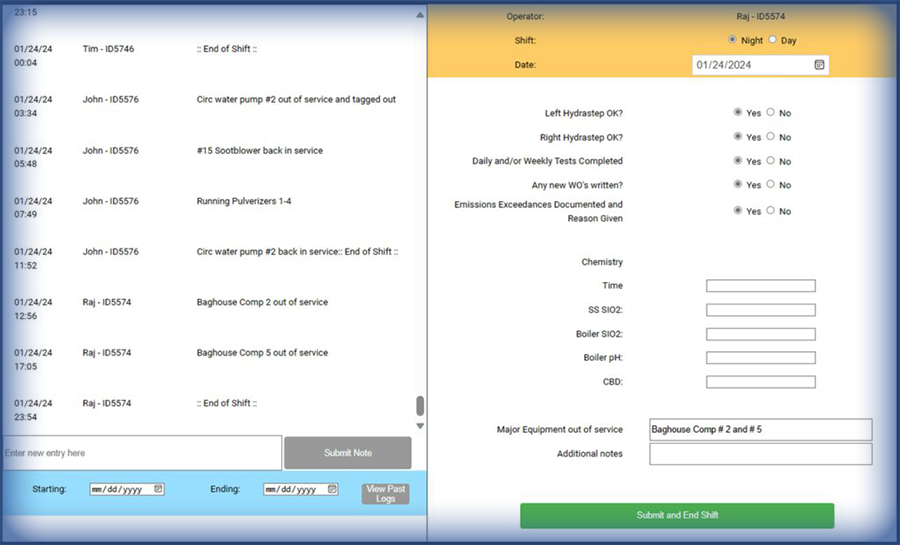
Extend Taber's dashboards from monitoring and visualizing to supporting direct interaction to make possible logging, reporting, and “what-if” evaluations using Taber's AI and modeling abilities. Building upon the concept of “fully customizable”, Taber's interactive dashboards can be your solution to more effective and meaningful site reporting and long-term logging.
![]()
Couple this with the ability to automate notifications (through email, Microsoft Teams, Slack, etc.), generate and distribute automatic PDF reports, and other workflow features - Taber's systems are capable of fulfilling any process visualization, monitoring, and reporting needs that you have.