Taber offers our Hg PAC Control Optimization application to help sites better manage mercury emissions while reducing their overall costs on pulverized activated carbon (PAC or ACI). This application optimizes for tighter control versus rolling average emission limits and for PAC injection savings.
![]()
Many typical implementations configure the PAC feedrate adjustment to react directly to either instantaneous Hg stack emissions or period manual stack samples with little or no regard to the rolling average impact or the impact on other combustion variables such as opacity and/or precipitator operation.
Taber’s HgPACopt application is easily tunable allowing live adjustment to many control factors in order to realize varied control strategies and consideration of multiple time horizons. The basic concept uses a 30 day rolling average goal for the plant or site and determines the most effective amount of PAC required for maintaining the average within the selected margin. Generally, as more PAC is added to the flue stream each incremental add of PAC will reduce Hg by a lesser amount (i.e., diminishing returns). HgPACopt is setup to recognize this and seeks to keep the PAC average rate at the lowest possible level while still achieving satisfactory Hg removal.
Short term instantaneous readings are smoothed out, preventing oversupply of PAC to a temporary spike in Hg, which is often over before the PAC can affect the process. Feedrates are biased or controlled directly on a time cycle more closely matching the expected changes in fuel over time. Adjustments may be made to accommodate high opacity or other combustion situations where it is desirable from an operator’s standpoint to have PAC reduced. When conditions warrant and the PAC injection is deemed to be in an effective control zone, margin may be built up in the rolling average such that later instances of high-mercury coal or needed system maintenance can be much more easily tolerated without causing upsets.
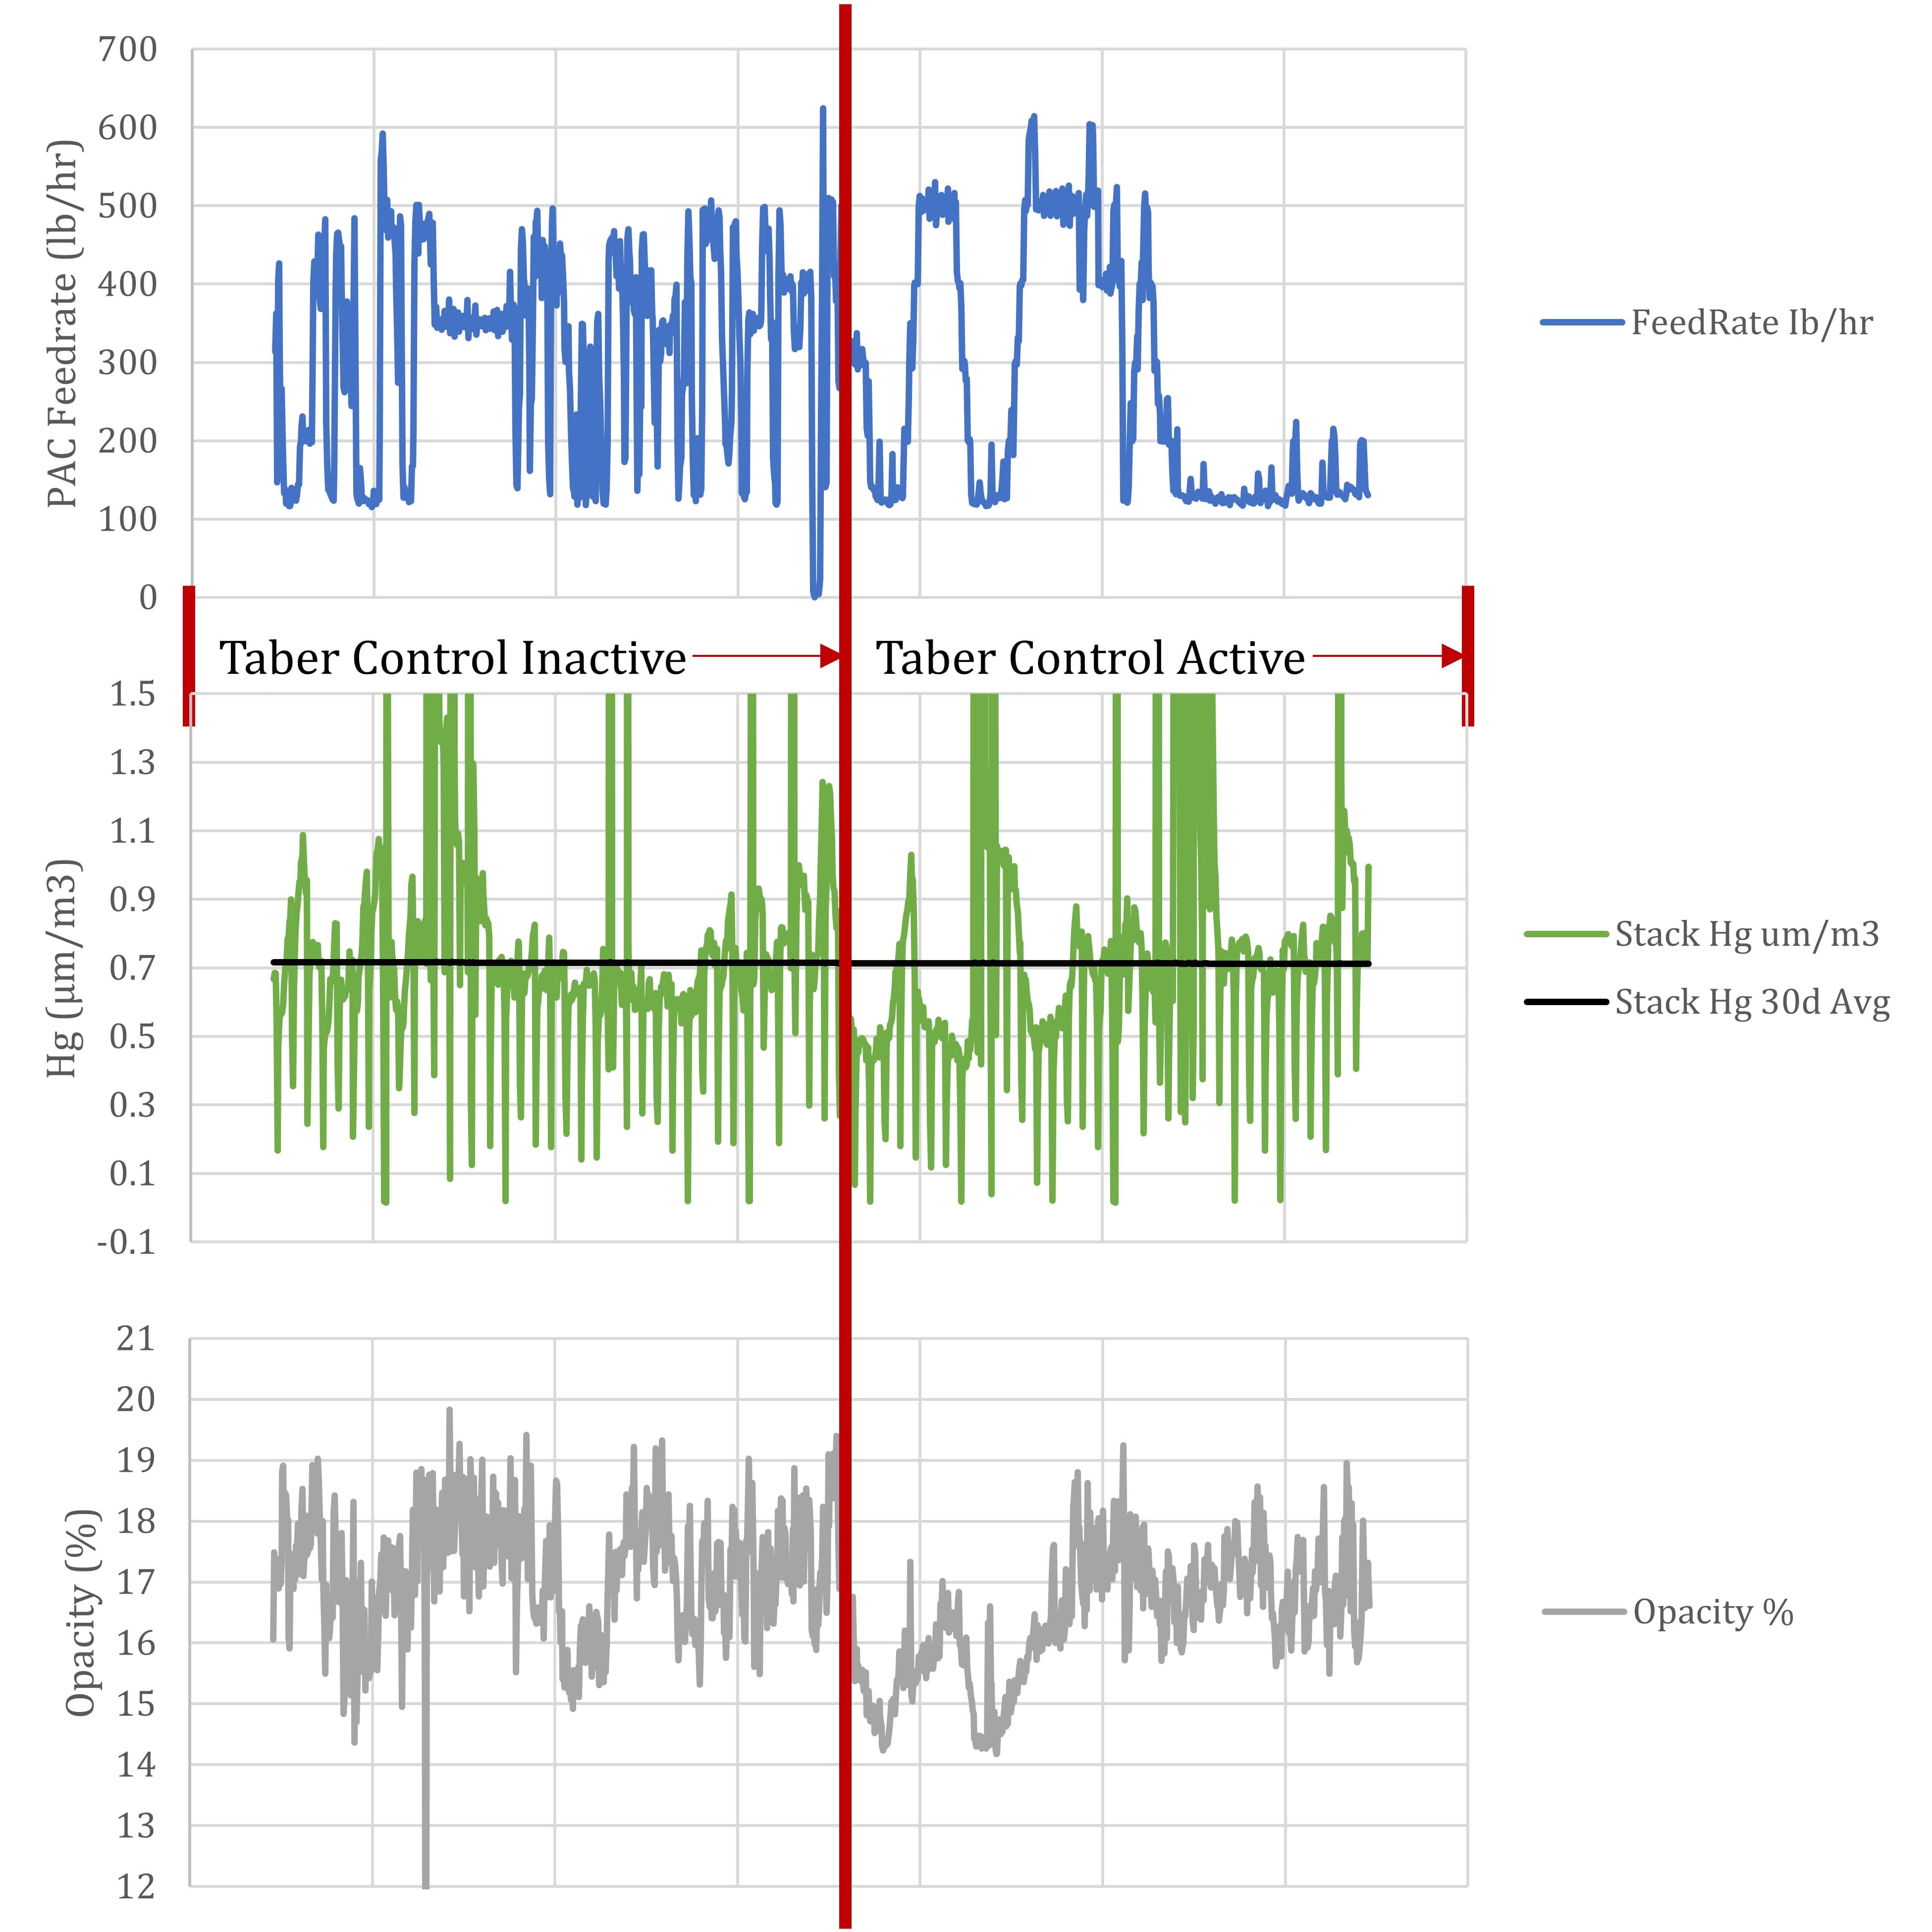
Results
1. In this example, opacity is reduced and kept out of alarm conditions
2. The PAC feed-rate is much steadier, helping smooth the overall process and reduce overall PAC usage.
3. The Hg emissions are slightly noisier, but the 30-day average is improved.
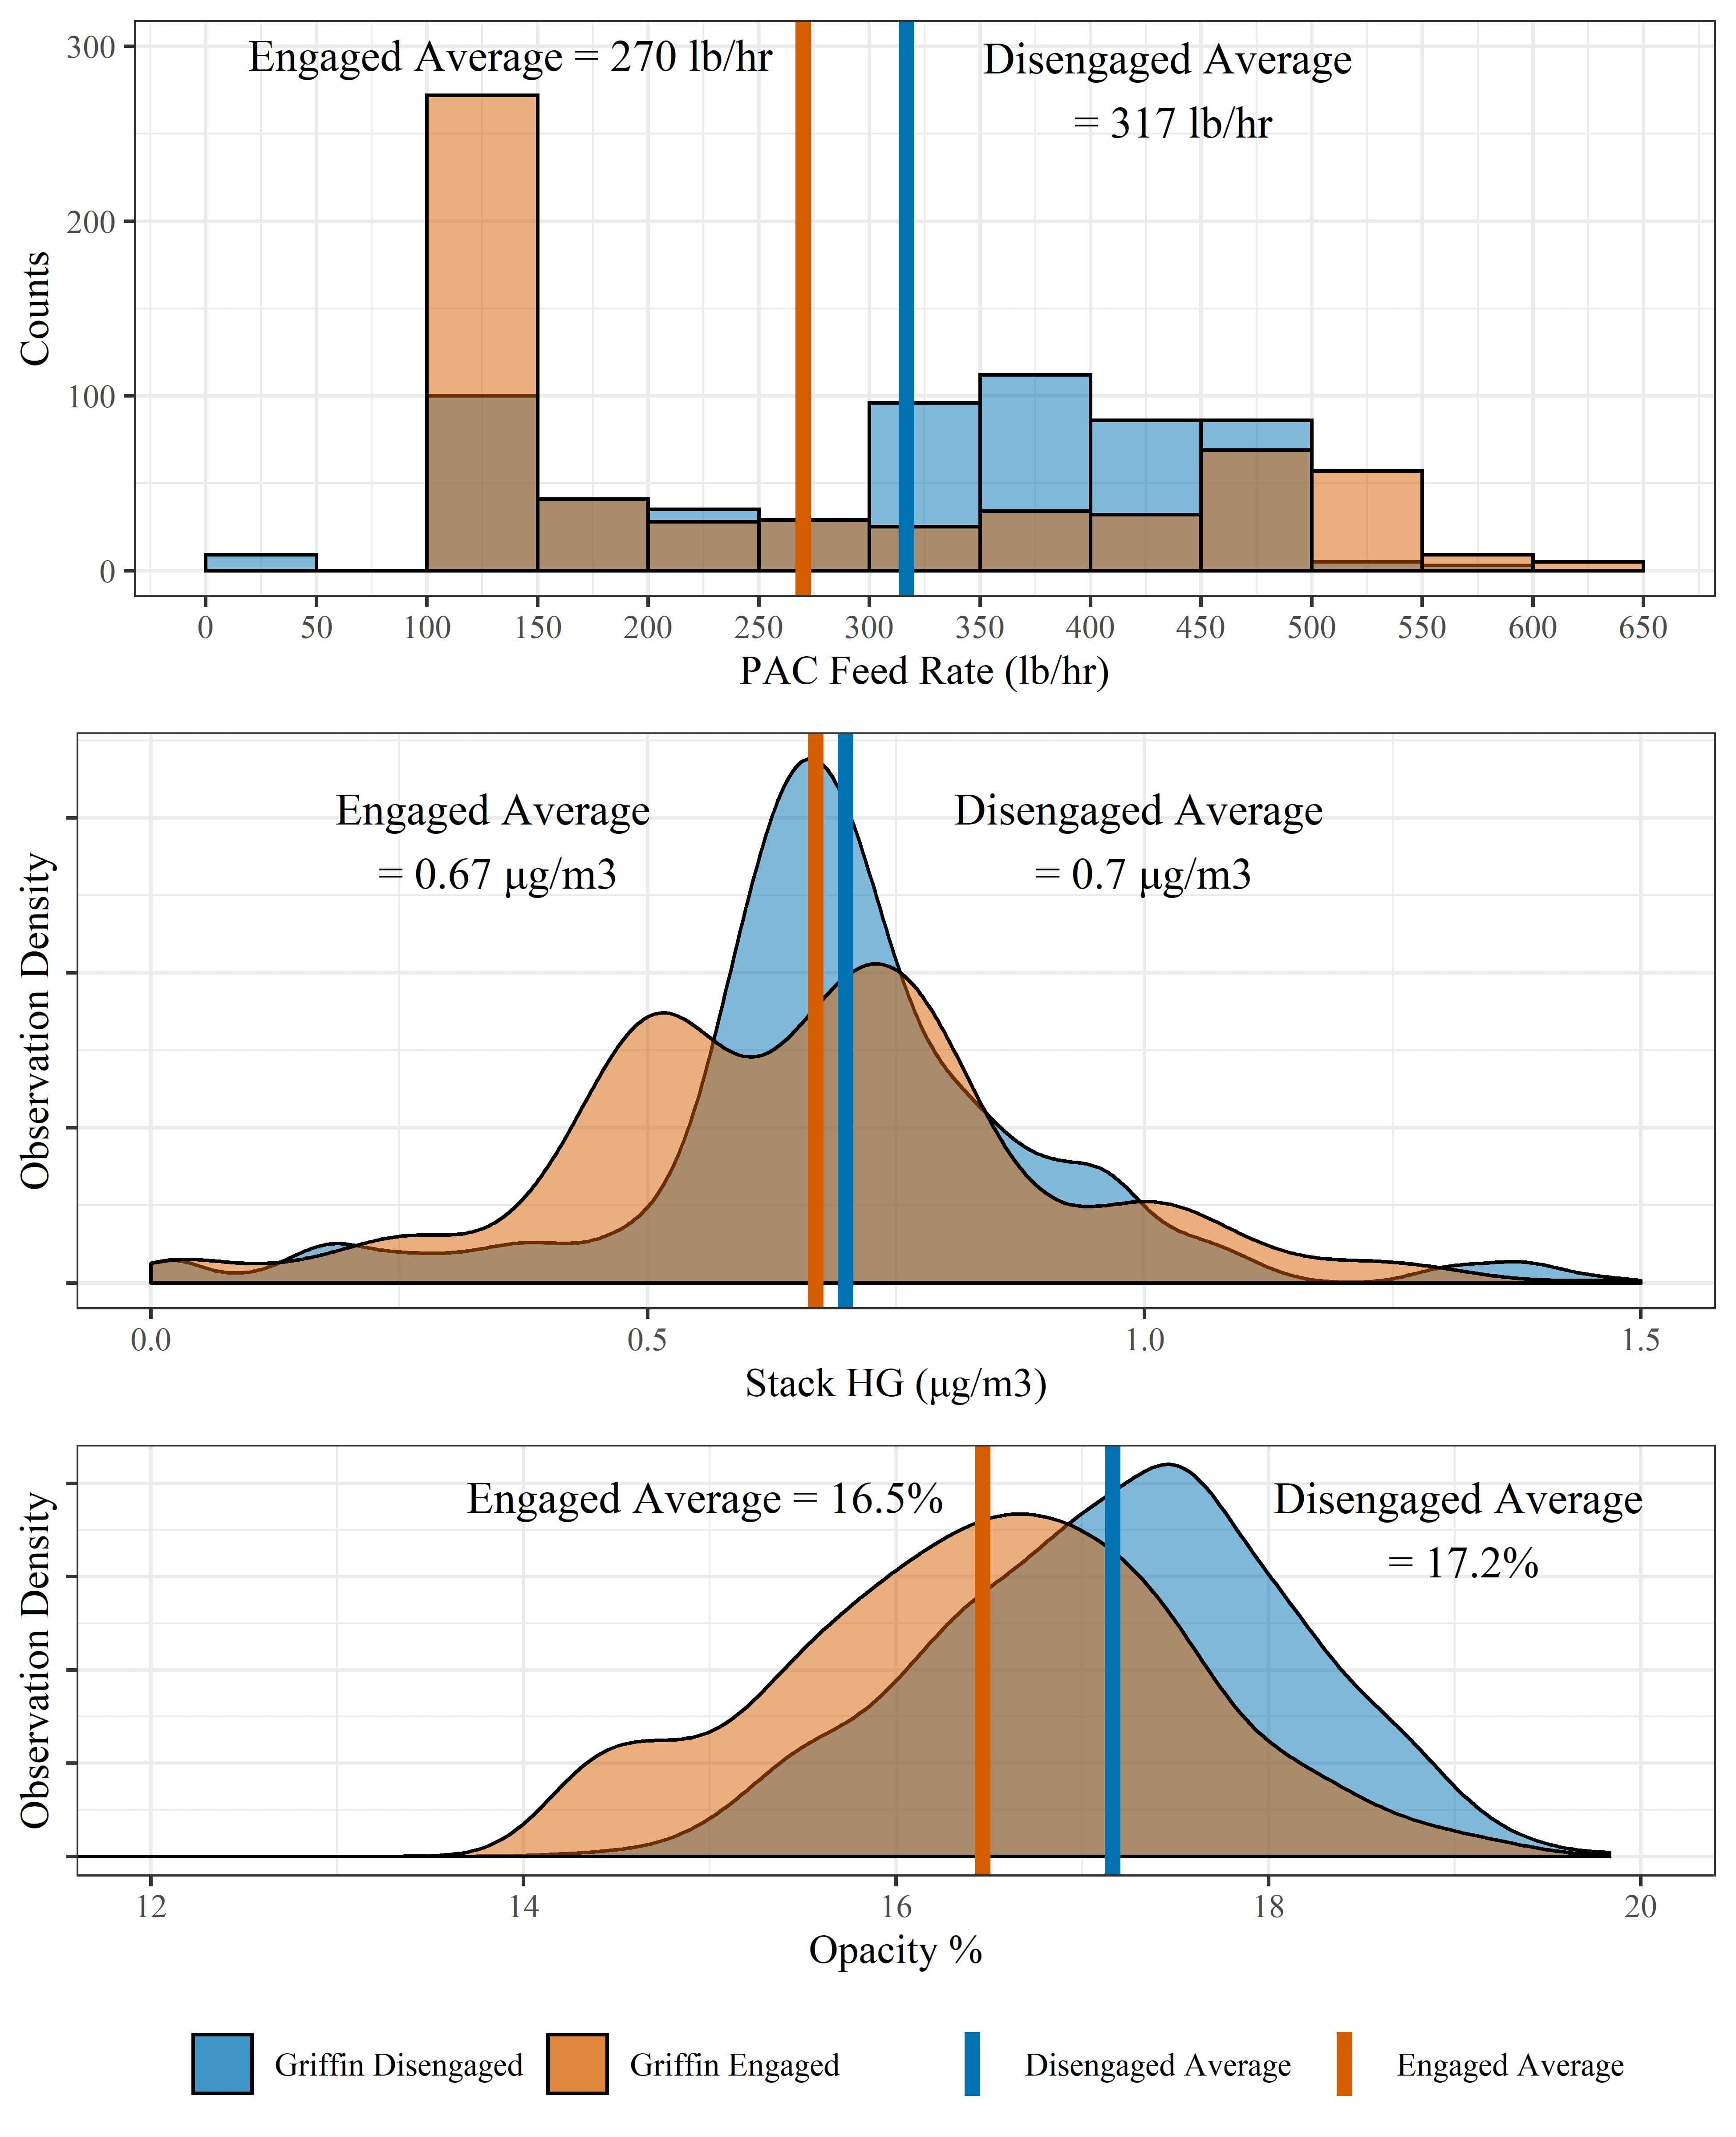
When the averages of each period displayed are compared, it is clear that use of Taber’s HgPACopt application improves all aspects of the process, reducing PAC consumption, avoiding process and opacity upsets, and improving average Hg emission rates.
optimize the complex, automate the mundane
talk to an expert